The stock market is full of different patterns of growth, price hikes, and other criteria. Candlesticks are tools to understand and analyze trading trends of the market at different instants of time. It helps the technical analysts and investors to make a fair judgment for investing in stocks. It allows the investors to judge and analyze which stocks are best for them as per growing trends. Candlestick pattern are used to predict the most probable future growth or failure of specific stocks. These stock’s candlesticks patterns are formed by combining two or more candlesticks for the same stocks. These candlesticks patterns can highly affect the profit you will earn out of your investment.


However, making and analyzing these candlestick pattern can be done in various ways. Following are 30 top candlesticks patterns in which stocks’ future is predicted. Majorly, candlesticks patterns can be classified into three main categories, namely:
Bullish Reversal Candlestick Pattern
Bullish reversal candlesticks patterns show that the current falling trend of a stock growth can be reversed and can be turned into a growing trend. Bullish reversal candlesticks patterns stand for different patterns to show the reverse action in the current growth side of specific stocks. Traders must consider bullish reversal candlestick patterns seriously to invest Profitably.
Continuous Candlestick Pattern
Continuous candlesticks patterns are used where the trends are not varying majorly. The stocks having almost constant trends over a period will have continuous candlesticks patterns. Investors who wish to invest extra money in a stable stock can look for continuous candlesticks patterns.
Bearish Candlestick Patterns
Bearish candlesticks patterns are the opposite of the bullish reversal candlestick patterns. It shows the change in upward trends in a stock trading for a particular stock to the downward pattern. If the investors are planning to invest in particular stocks of a company for a long time, they must consider paying more importance to bearish candlesticks patterns.
List of Top 30 Candlestick Patterns
Including these three categories, we have listed 30 top candlestick patterns widely used by stocks analysts. These patterns can be analyzed quickly and accurately. Candlesticks patterns popular amongst stocks analysts are:
Hammer Candlestick Patterns
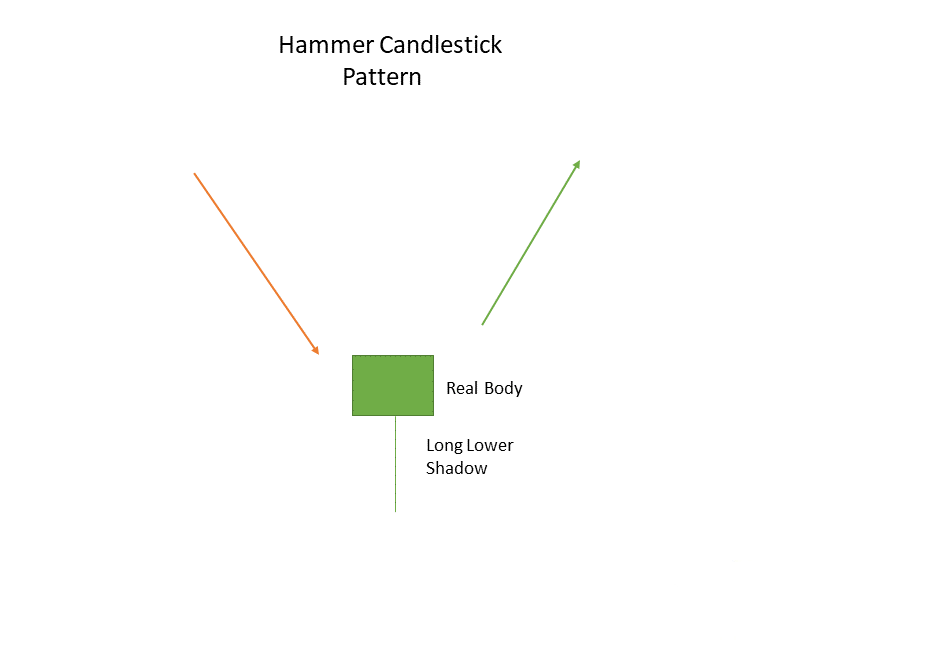
Hammer is a kind of Bullish candlestick pattern in reversal format. It is a unit and singular candlestick pattern showing the downstream end of the growth of a stock. It is indicated at the end of a particular trend and indicates a bullish reversal at that point. The main feature of these candlesticks patterns is that they have a higher lower shadow than lower. The higher shadow in this candlesticks pattern is double the actual body length of the candle. This pattern indicates the pushed-down prices by the purchasers of certain stocks right after the market opened.
Piercing Candlestick Pattern
These patterns fall under bullish candlestick patterns. These patterns are a combination of two or more patterns in one. It is created at the end of bullish reversal candlesticks patterns for stocks. A piercing pattern is a combination of two candlesticks in which it includes a bearish candlesticks pattern. This bearish pattern shows a continuously downward moving trend in stocks growth. However, the second candle is a bullish candle that is formed along with it. This bullish candlesticks pattern closes up to 50 percent of the current candle. The presence of a bullish reversal candlesticks pattern shows that the prices may go down again.
Bullish Engulfing
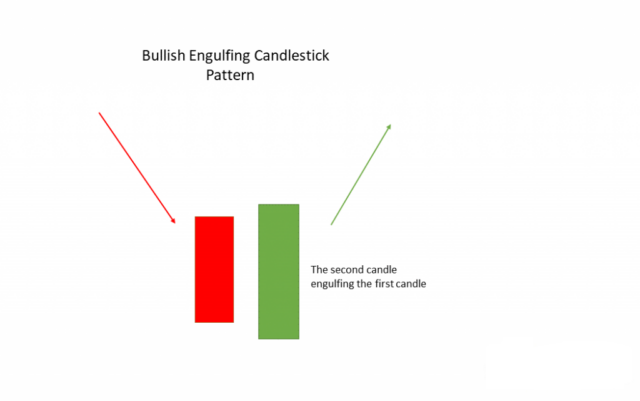
Bullish engulfing consists of more than two candlesticks patterns along with the basic idea of the bullish trend. The primary trend showcased by bullish engulfing is the downward trend of growth of specific stocks. The pattern is formed by two different candlesticks engulfing a single candlestick. This shows that the downward trend of the concerned stock is moving downward in a continuous manner. Stocks having these candlesticks patterns. Only the investors looking for an extended investment plan can benefit from it.
The Morning Star
This pattern is formed after the location of specific bullish candlesticks patterns. This pattern is formed by adding multiple candlesticks patterns. It is formed with three different candles, each with a different approach. The first candle is of a bearish kind showing continuity in a downward trend. The second coming in line is of Doji kind showing powered prices of stocks in the market. However, the third one is of bullish candlesticks patterns type and shows that bullish reversal occurs.
Three White Soldiers
A relatively simple combination of three bullish candlesticks patterns kind of candles. However, in this pattern, the candles do not have high shadows. The shadows of each ascending candle are covered under the actual body of the previous one. It represents a bullish reversal in stocks trends.
White Marubozu
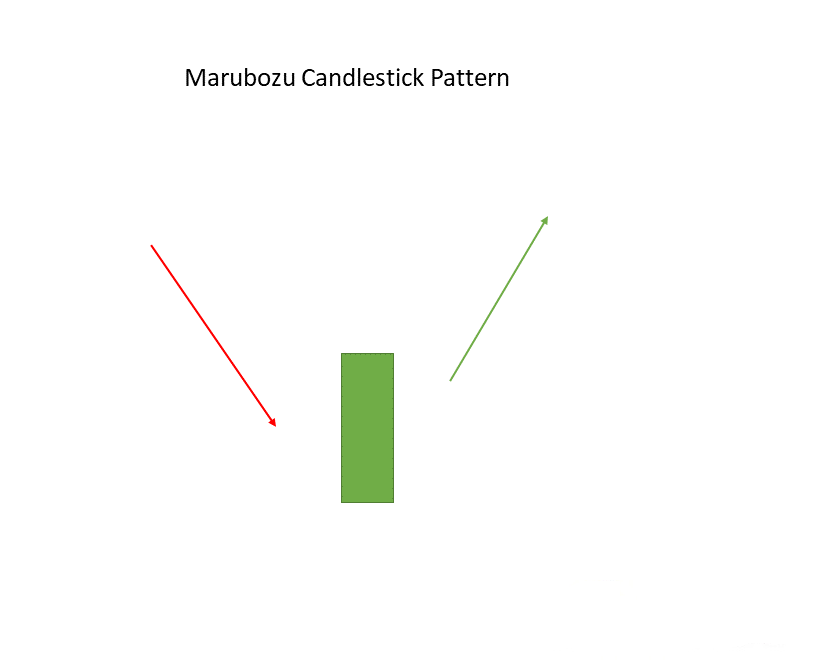
It is a pattern formed by a single candlestick after a bullish pattern. In this pattern, the actual body of the candle is the only region included. This candle doesn’t come with a lower or higher shadow of high dimensions. It is used to represent bullish reversal occurring in a trend. It shows how the market is pressured to lower the prices.
Three Inside Up
Three inside-up bullish candlesticks patterns are formed by combining three bullish candles of different sizes. The first candle must lie in the same range as the shorter one. However, the third candle is longer than the middle candle to indicate a guaranteed bullish pattern in stocks trading. For long time investments, the investors must study this pattern carefully.
Bullish Harami
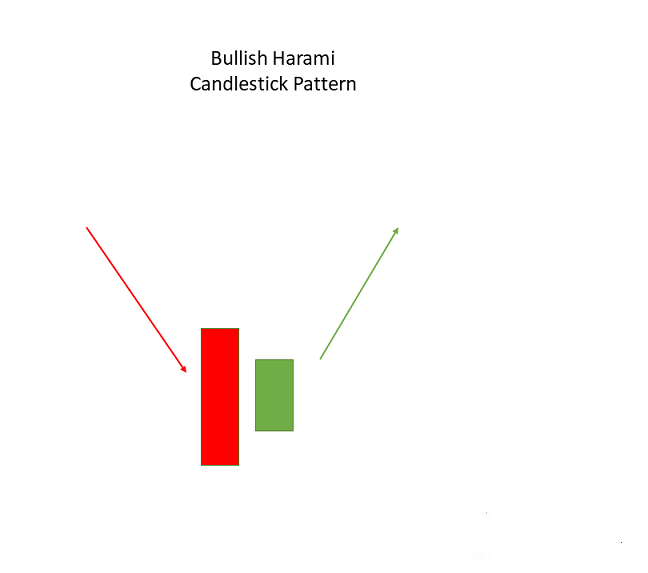
In this type of candlesticks pattern, two different candlesticks are combined to form one. It is formed after the completion of a downward trend in the graph of the stock. The first and longer candle is of bearish pattern, which shows that the current downward trend is continuous. The other candle accompanying this will be shorter yet in the same range. This candlestick will be of bullish pattern to show a bullish reversal pattern at a certain point.
Tweezer Bottom
The tweezer bottom is a kind of bullish candlesticks pattern and obtained at the end of a downtrend. This pattern consists of two candlesticks. One of the bearish patterns and another one of bullish candlesticks patterns. The sizes of these candles are somewhat the same. However, the candle of bullish candlesticks patterns is smaller than the bearish kind. This pattern is validated by the bullish candlesticks the next day it is formed.
Inverted Hammers
As the name indicates, it is an inverted form of the hammer candlestick pattern. It is used whenever the stock opening prices and closing prices are in proximity to each other. The upper shadow in this pattern is longer than the real body. Mostly, double the size of the natural body of the candle. It is a kind of bullish candlesticks patterns.
Three Outside Up
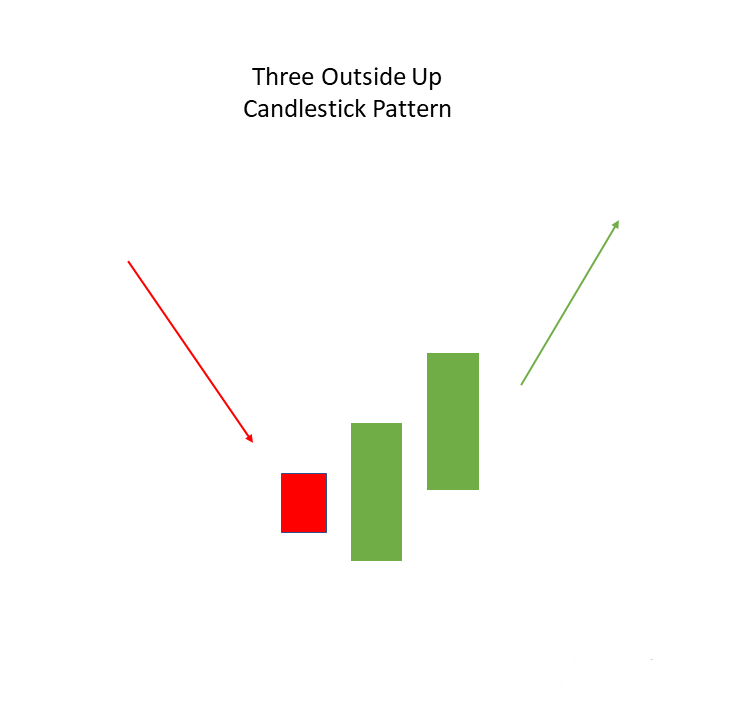
This pattern is based on the bullish candlesticks patterns. It is formed by combining three different candles inaccurate order bearish candlesticks and two bullish candlesticks, respectively. The first bearish candlestick is smaller. The candlestick covers it besides it. The longer candlestick is of a bullish kind. It is ended by a bullish candlestick which confirms the bullish reversal trend.
On- Neck Pattern
This pattern Is is formed by combining two candlesticks: one of the bullish reversal patterns and the other of bearish patterns. It is used in scenarios where stocks’ opening and closing prices are either the same or very close. Thus these prices form a Horizontal line looking like a neckline. They lie in the same line after the closing and opening of the price of a stock.
Hanging Man
Hanging Man is a simple candlestick pattern formed by a single candle. It is formed at the end of an upward moving trend of the stocks. It indicates a bearish reversal. The upward shadow of the candle in this candlestick pattern is double the actual body size. This shows that when the market opened, the prices hiked and were pushed by the traders selling stocks.
Dark Cloud Cover
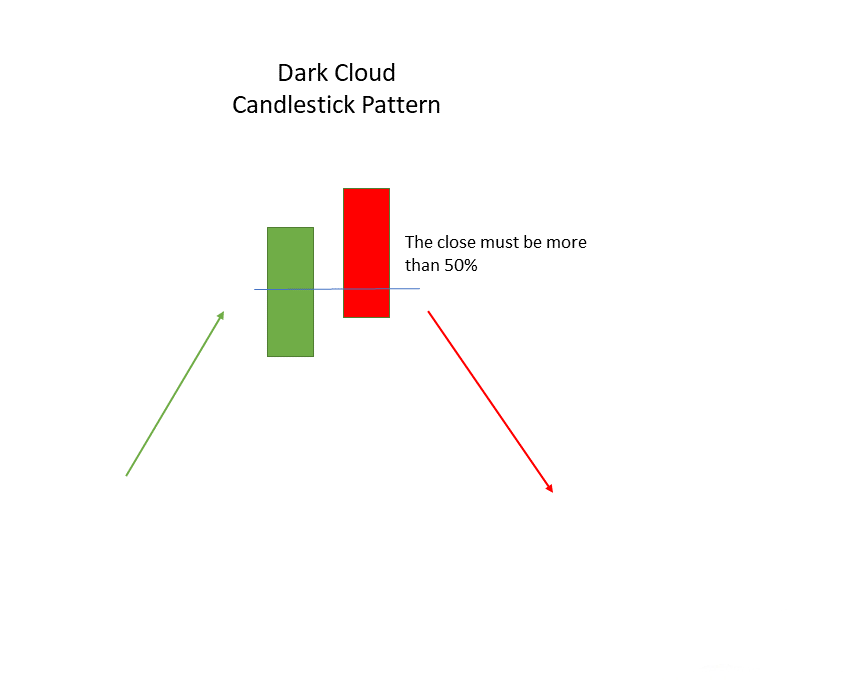
Dark cloud cover is a candle formed on the bearish candlesticks pattern showing continuing trends. The dark cloud cover is formed by a set of candles where bullish and bearish patterns are joined. The bearish candle covers up to half of the actual body size of the previous bullish candle. Polish candle shows the upward moving trend of the stocks and their growth. Upon analysis, this pattern shows that there are chances of bearish reversal at a certain point in the trend.
Bearish Engulfing
Bearish engulfing is a type of bearish candlestick pattern. This pattern comes with a candle of medium body shape engulfed by a bullish candle of larger size. The second candle shows that the upward moving trend is continuous. The pattern indicates that bears dominate the market. This candlestick pattern is beneficial for investors looking for long-term investments.
The Evening Star
It is a different pattern formed by three individual candlestick patterns combined into one. The first candle is of bullish candlestick pattern, whereas the other two are doji and bearish. The size of the 2nd candle, which is doji is more than the respective sizes of bullish and bearish candles. If investors notice the formation of bullish candlestick the next day, they can invest long-term into it.
Three Black Crows
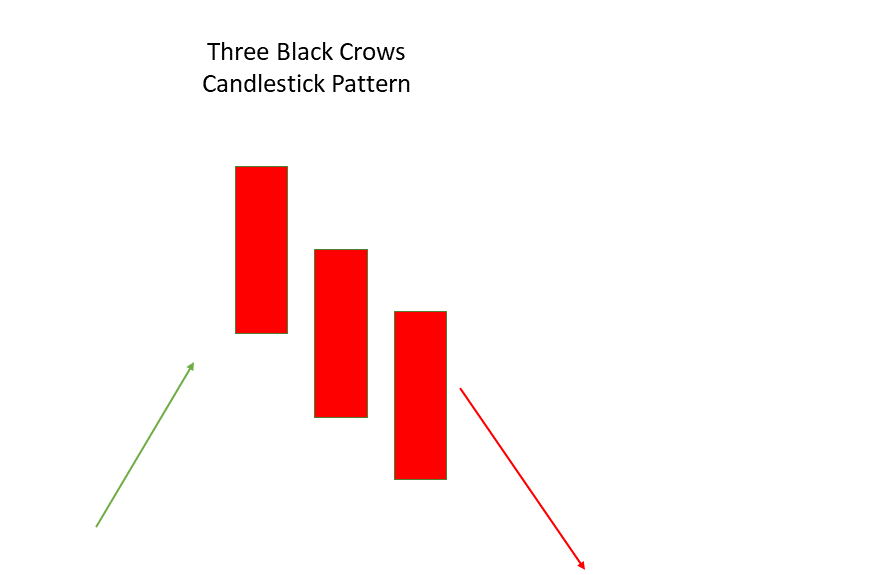
The three black crows are formed at the end of an inevitable upward trend where bearish reversal is expected. As the name suggests, it comprises three candles. Each candle is of Comparative size to the other one with small higher shadows. These shadows lie in the body of the other two candles accompanying it. All the candles are connected to form a single candlestick pattern and show the location of the reversal pattern at specific points.
Black Marubozu
It is a type of bearish candlestick pattern. It is a single Piece pattern formed at the end of the upward trend. This pattern does not come with any shadows at higher or lower ends. The pattern indicates that the sellers are under the pressure of changing the prices according to the market. Investors looking for an opportunity to invest in the changing trends of stocks can look for this pattern as it can help them invest in the stocks according to the changing trends in the graphs.
Three Inside Down
Three inside down is a pattern made by combining different candles as a unit. It is formed at the end of an uptrend in the graph of the stock. It comprises three bearish and bullish pattern candlesticks. The first candle is large with no or less shadow at both ends. It is of bullish candlestick pattern. The second candle is of bearish pattern within the first existing candle of a bullish pattern. There is a short position available for the investors to invest in the stocks after the ending of this pattern.
Bearish Harami
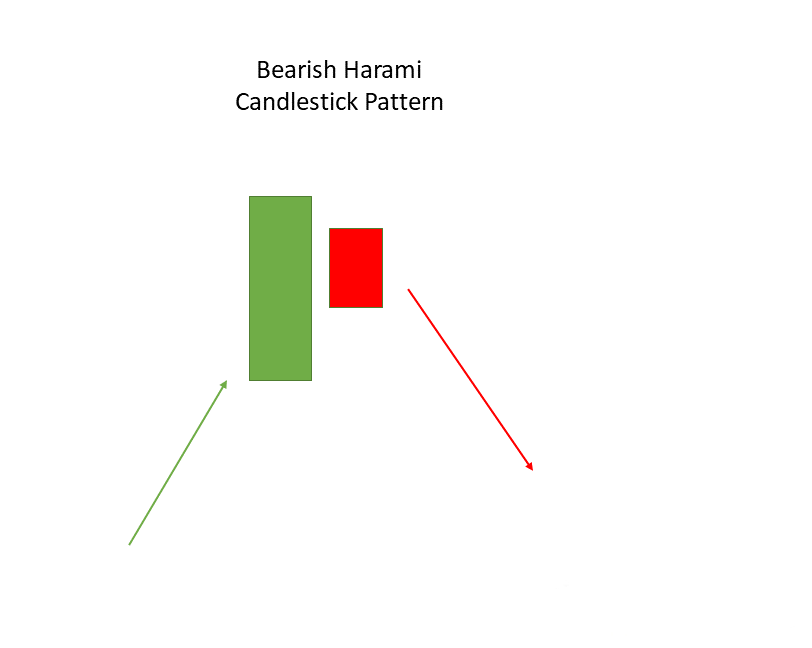
Bearish harami is a bearish-based candlestick pattern. It comes with two different candles. One candle is of bullish candlesticks pattern and is longer than the other one. This taller candle is well capable of overshadowing the smaller candle. The smaller candle, however, is of a bearish pattern. They lie in the same line. The bearish harami candlesticks pattern shows that the bulls are putting pressure on the market. At the same time, the bullish candle shows continuity in the trend.
Shooting Star
Shooting star shows the possibility of bearish reverse pattern formation after the end of an upward moving trend. In this candlestick pattern, the real candle body is located at the end and has high upper-end shadows. This pattern looks like the inverted hanging man pattern. The upper-end shadow in this pattern is higher than the candle body. This pattern indicates that the opening and closing prices of the stocks are close to each other.
Tweezer Top
They are a kind of bearish reversal pattern candlestick. It comprises of two candlesticks joined as one. The first candle is bullish pattern-based, and the other is bearish. In this pattern, the height of both the candles is identical or close. However, the first candle shows an upward trend in data.
Three Outside Down
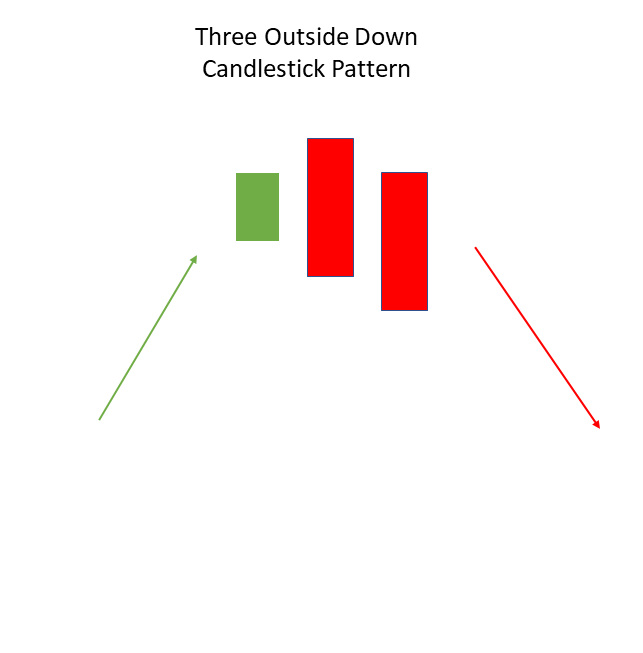
This pattern comprises three different candles with different characteristics. The first one is bullish; the second is a significant bearish type candlestick, whereas the third is simply a smaller bearish pattern candlestick to ensure the happening of the bearish reversal situation in the current trend.
Doji
Doji candlestick pattern is different from bearish and bullish. It indicates that the opening and closing prices of certain stocks are constant and equal. It can be easily understood as the tiebreaker between the bulls and the bears of the market. This pattern shows the constant nature of the market and trend.
Spinning Top
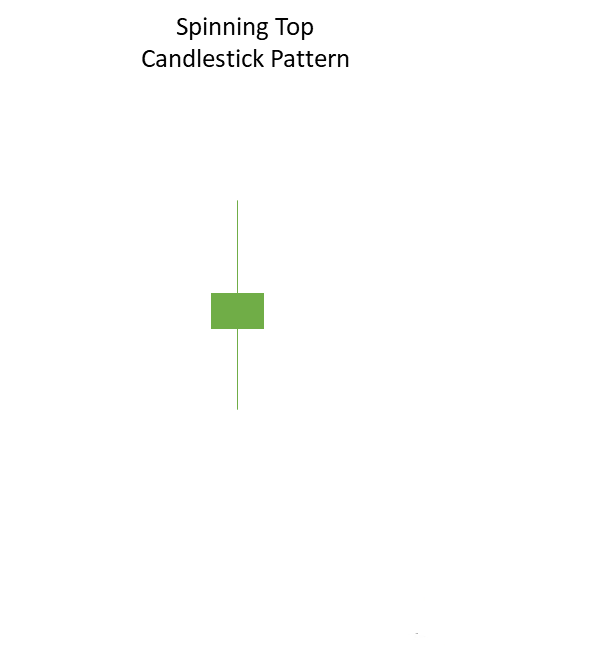
The spinning top also depicts the constant nature of the trend. However, the shape and size are the primary difference between the spinning top candlestick pattern and the Doji pattern. The size of the candle’s real body in the spinning top pattern is more significant than that in the Doji pattern.
Falling Three Method
This candlestick pattern includes five candles lined up together to form one combination. It is a kind of bearish pattern but does not depict a reversal of the current downward trend. It consists of two long candles lined in the direction of the trend, and the other three smaller candles are shown as counter-trend candles in the middle.
Rising Three Method
This pattern is based on the bullish candlesticks patterns. It consists of two large candles shown in the direction of the trend. And the other three small candles are lined as counter candles for the trend moving in up direction. It shows the investors that the bulls are still in charge and bears cannot turn the trend in the reverse direction. However, in this case, the trend is considered to go upwards.
Upside Tasuki Gap
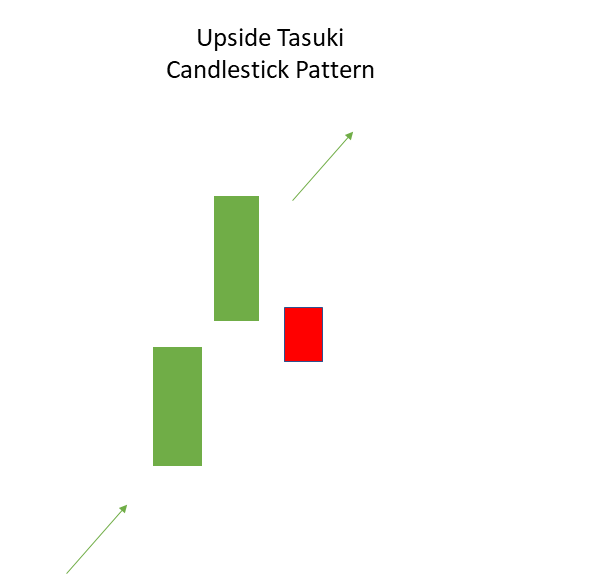
It is a pattern using bullish candlesticks patterns along with the uptrend. It has three different sizes of candles. The first and the largest one is of the bullish kind. The second, slightly smaller than the other, is also bullish, accompanied by a bearish candle at the end. The third candle is fitted into the gap between the first two bullish candles.
Downside Tasuki Gap
This pattern is formed by bearish pattern candlesticks moving along the downward trend. It also consists of three candles, including two bearish and one bullish candle. The largest and the second candle is of a bearish kind, whereas the candle between the gap of these two is of a bullish kind.
Mat Hold
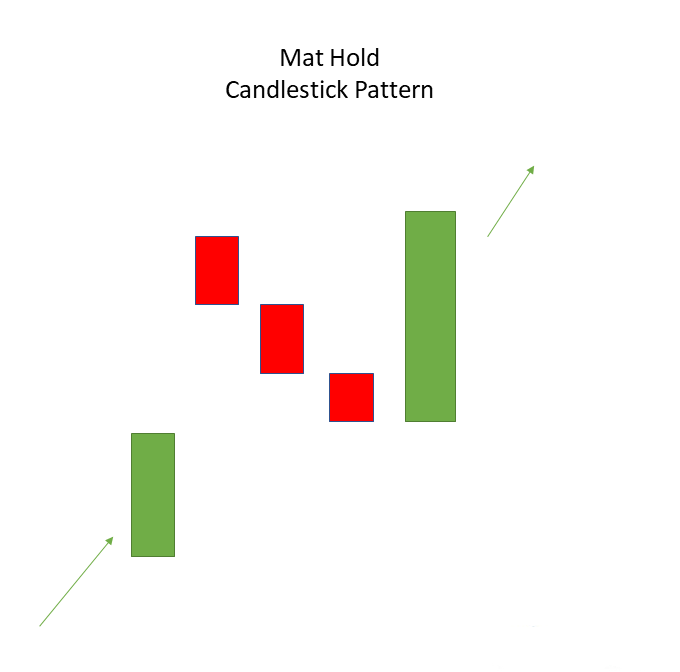
Mat hold candlesticks pattern is a simple showcase of continuation of the ongoing or previous trend. It can be bullish or bearish. It comes with two large candles of a bullish kind with three smaller candles to fill the gap between the two large candles.
The up-listed candlestick pattern can help you to determine the trends and examine the situation of the market. It can highly benefit the investors looking for smart investing. As a result of which they can have high rates of profit in their pockets.
Here are the top 10 factors that you should check before buying a stock.
Frequently Asked Questions (FAQs)
- Which is the most reliable candlestick pattern?
In our opinion, there are five candlestick patterns that we think are most accurate and time-tested. They are Doji, Engulfing pattern, Morning star, bearish engulfing pattern, bullish engulfing pattern, and evening star.
- Which are the most bearish candlestick patterns?
The bearish patterns can contain multiple or single candlesticks. Other than this, it should also form after the uptrend. If not, they will only seem like continuation patterns. The most potent bearish candlesticks are hanging man, the evening star, bearish engulfing, dark cloud cover, and the three black crows.
- What is a Candlestick Chart?
It is a Japanese chart that you can use to describe the financial movement of stocks, currency, or security. Each candle refers to one day of a month. So, if there are 20 trading days in a month, there will be 20 candles in the chart.
- What is a Doji Candle?
The Doji candlestick chart is formed when the stock’s opening and closing are the same for the specified period. The Japanese meaning of Doji is mistake or blunder. It implies that there are scarce chances that the opening of stock and closing prices are the same.
- Does the Candlestick pattern work?
To answer this, you must know that the candlestick patterns are created according to the up and down price of a stock. Because of this, sometimes, a random chart is made, and sometimes, there is a pattern of these candlesticks. When the patterns are formed, different traders can use them to analyze the movement in the stock. But, if you ask if they always work, Well, NO.